
Data Analysis using Excel Pivot and SSAS
In excel using pivot data can be reshaped in any shape.
Once you connect your data model with excel pivot you are easily analyse data in any shape. Provided underlying data model is well defined. For small use cases where data volume is limited or records volume is less than 1 million rows you can store data in excel file itself.
Huge data analysis
When data volume is not manageable inside excel workbooks. You need to move to Microsoft Analysis services for quick query response. Develop data warehouse in SQL server, My SQL or Oracle. Make data cubes in SSAS and configure with DW. Make sure facts, dimensions relation is well defined. For small cases you can use Visual studio data tools to develop MS BI application. Once BI application is ready deploy on SSAS and process data with SSAS. Connect MS Excel with SSAS and prepare pivot.
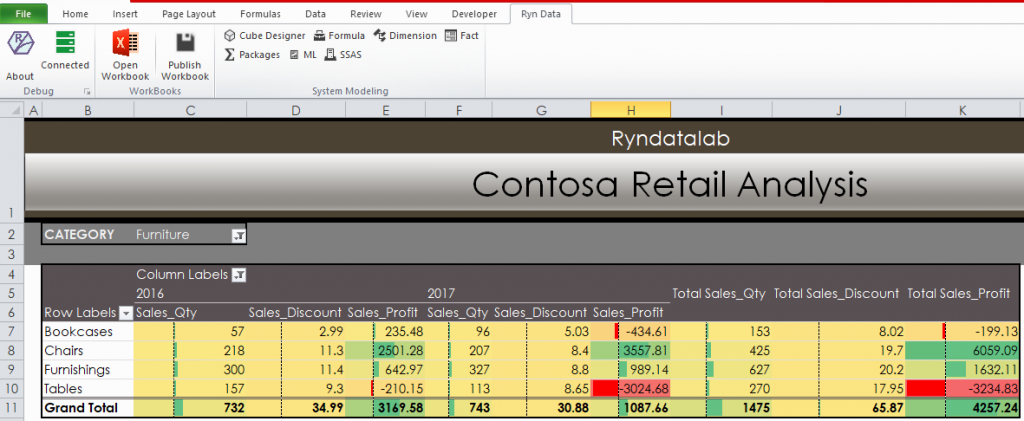
Microsoft SSAS and MS excel Pivot has really good integration for leveraging analytical features. On fly you can create report in excel in any shape of without having knowledge of SQL query and software development. In general Grouping, Hierarchy, Sub total, Total, Grand Total, data formatting, allocation mode for editing are ultimate feature. Using these features you can view data is more comparative and analytical way.
RynData Business Intelligence Software
RynBI gives Integrated framework for DW setup, data modeling, data source integration, reporting and analytical tools integration under one framework. As a result complicated BI development becomes easy and fast for development and maintenance.